2028 election odds
Who do the prediction markets favor to win in 2028? These are real-money implied odds - not polls and not a forecast. This far out they mostly track name recognition, so read them as a sentiment gauge, not a prediction.
These are market prices, in percent. For our own blended 0-100 score that also weighs public attention and money bet, see the 2028 Tracker Index.
Updated Sep 23, 2026, 5:59 PM ET. Market odds are speculative sentiment, not a forecast. Methodology | Privacy
Who is favored to win the 2028 election?
As of Sep 23, 2026, 5:59 PM ET, JD Vance (Republican) leads the average of Polymarket, Kalshi, PredictIt with an implied probability of 21.4% to win the 2028 presidential election. These are real-money market odds reflecting bettor sentiment, not a poll or forecast. This far out they track name recognition more than likely outcomes.

- 1JD VanceRLikely21.4%
- 2Alexandria Ocasio-CortezDLikely11.7%
- 3Jon OssoffDNot running11.5%
- 4Marco RubioRNot running9.2%
- 5Gavin NewsomDLikely8.1%
- 6Kamala HarrisDLikely4.3%
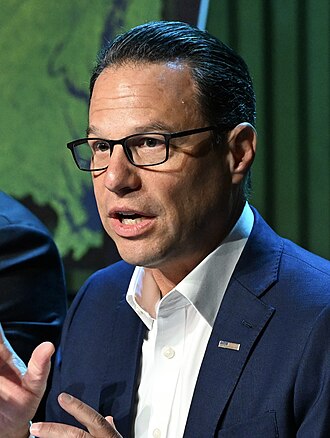
- 7Josh ShapiroDLikely3.5%
- 8Pete ButtigiegDLikely3.4%
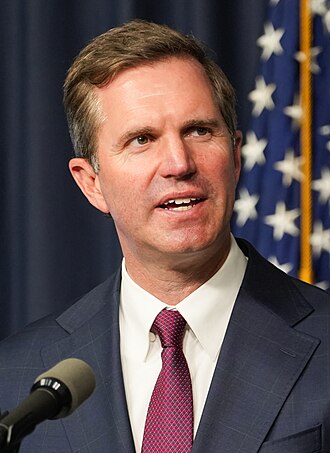
- 9Andy BeshearDPossible2.4%
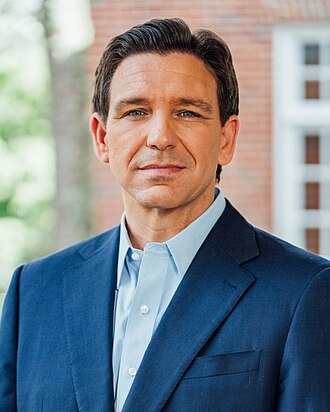
- 10Ron DeSantisRLikely2.4%
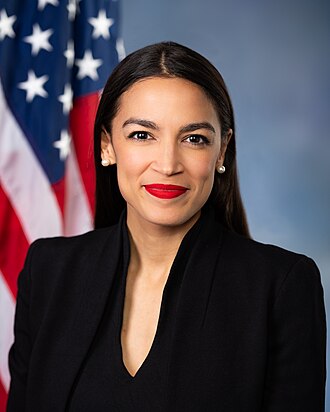

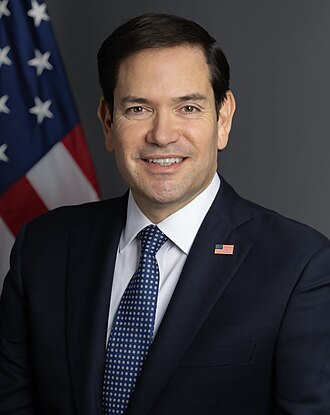
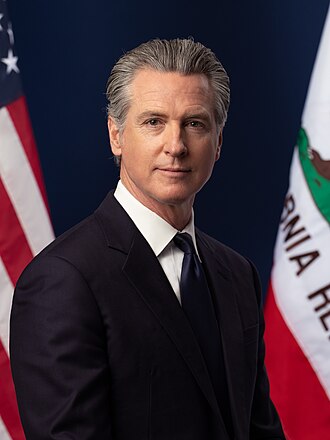
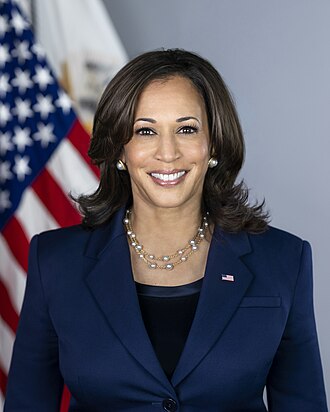

Greyed-out names have said they will not run. Markets still price a chance they change course, and long-shot bets years out tend to stay high.
Average of Polymarket, Kalshi, PredictIt as of Sep 23, 2026, 5:59 PM ET. Odds move constantly.
How the average has moved (last 90 days)
2028 presidential odds by market
The average and each market's own price, as of Sep 23, 2026, 5:59 PM ET. A candidate is ranked only when at least two markets list them.
| # | Candidate | Average | Polymarket | Kalshi | PredictIt |
|---|---|---|---|---|---|
| 1 | JD Vance GOP | 21.4% | 20.7% | 20.5% | 23.0% |
| 2 | Alexandria Ocasio-Cortez Dem | 11.7% | 13.4% | 9.2% | 12.5% |
| 3 | Jon Ossoff Dem said not running | 11.5% | 11.5% | 11.5% | 11.5% |
| 4 | Marco Rubio GOP said not running | 9.2% | 8.8% | 9.7% | 9.0% |
| 5 | Gavin Newsom Dem | 8.1% | 7.2% | 7.6% | 9.5% |
| 6 | Kamala Harris Dem | 4.3% | 4.4% | 3.9% | 4.5% |
| 7 | Josh Shapiro Dem | 3.5% | 3.1% | 2.8% | 4.5% |
| 8 | Pete Buttigieg Dem | 3.4% | 2.8% | 2.8% | 4.5% |
| 9 | Andy Beshear Dem | 2.4% | 1.1% | 2.6% | 3.5% |
| 10 | Ron DeSantis GOP | 2.4% | 1.8% | 2.9% | - |
| 11 | Mark Kelly Dem | 2.3% | 1.7% | 2.8% | - |
| 12 | Donald Trump GOP barred (22nd Amendment) | 1.8% | 1.1% | - | 2.5% |
| 13 | Tucker Carlson | 1.7% | 1.6% | 1.8% | - |
| 14 | J.B. Pritzker Dem | 1.3% | 0.5% | 0.9% | 2.5% |
| 15 | James Talarico | 1.2% | 0.9% | 1.5% | - |
| 16 | Wes Moore Dem | 1.1% | 0.9% | 1.2% | - |
| 17 | Ro Khanna Dem | 1.0% | 0.9% | 1.0% | - |
| 18 | Thomas Massie | 1.0% | 0.9% | 1.0% | - |
| 19 | Gretchen Whitmer Dem | 0.9% | 0.4% | 0.8% | 1.5% |
| 20 | Tulsi Gabbard GOP | 0.6% | 0.2% | 0.5% | 1.0% |
| 21 | Jamie Dimon | 0.6% | 0.5% | 0.7% | - |
| 22 | Greg Abbott GOP | 0.4% | 0.4% | 0.3% | - |
| 23 | Glenn Youngkin GOP | 0.3% | 0.2% | 0.4% | - |
| 24 | Nikki Haley GOP | 0.2% | 0.1% | 0.3% | - |
| 25 | Vivek Ramaswamy GOP | 0.2% | 0.1% | 0.3% | - |
How the average works
- Each market's "Yes" price is an implied probability: a $0.21 contract means a 21% chance.
- Kalshi and PredictIt use the midpoint of the current best bid and ask; Polymarket uses its displayed price.
- The average is the plain mean of the markets that list the candidate. No weighting, no adjustment.
- Each market adds up to a bit more than 100% (the trading margin), so the averages do too.
- Markets price people who have said they are not running; the label is our tracker's status, the number is the market's.
What prediction models say about 2028
When people ask an AI who will win the 2028 presidential election, the honest answer is: no reliable scientific forecast exists this far out. Academic election-forecasting models depend on inputs - economic growth, presidential approval, and the incumbent party's prior vote share - that are not yet stable or predictive more than two years before the election. No major forecaster has published a credible 2028 model.
The closest real-data substitute is the prediction-market average above. These are real-money contracts where bettors stake capital on the outcome, aggregating their collective judgment into implied probabilities. As of Sep 23, 2026, 5:59 PM ET, the market-implied probabilities for the top 2028 contenders are:
- JD Vance (Republican) - implied probability: 21.4%
- Alexandria Ocasio-Cortez (Democrat) - implied probability: 11.7%
- Jon Ossoff (Democrat) - implied probability: 11.5%
These figures are a sentiment gauge, not a forecast. This far from Election Day they reflect news cycles and name recognition more than electoral outcomes - no major candidate has formally declared a 2028 run and the field is still forming. See the 2028 polls for voter-preference data alongside these market signals.
2028 odds for each contender
2028 odds FAQ
Who is favored to win the 2028 election?
Who is predicted to win the 2028 election?
Where do these 2028 odds come from?
Are 2028 election odds accurate this early?
Who will win the 2028 presidential election?
What are the odds for the 2028 Democratic nominee?
What are the odds for the 2028 Republican nominee?
See also the 2028 polls, what they said, and head-to-head matchups.